The Urban Transition in Ghana and Its Relation to Land Cover and Land Use Change Through Analysis of Multi-scale and Multi-temporal Satellite Image Data
Interdisciplinary Research in Earth Science (IDS) program
NASA Award #: G00009708
Background
Most countries in sub-Saharan Africa remain in the midst of a major transformation from being predominantly rural to having a majority of people living in cities. This has enormous consequences for urban and rural land cover and land use (LCLU). As urbanization proceeds, food security concerns grow not simply in tandem, but at a higher rate because urban development implies a higher caloric intake per person meaning that agricultural output (or income to buy another country’s output) must grow at a higher rate than the population (Weeks 2011). Urban growth is likely to lead to sprawl, which will convert good agricultural land to urban purposes. Land beyond the former urban periphery may then transition to agriculture. This land cover and land use change (LCLUC) transition sequence of natural vegetation to agriculture to low density built environment to high density is likely to perpetuate sprawl for the major urban centers. The need to increase agricultural productivity demands that traditional subsistence agriculture be modernized to increase per hectare yield. This typically leads, somewhat paradoxically, to a lower demand for rural labor because higher yield requires mechanization rather than human labor.

In this research project, we expand the range and scope of the project team’s current work in Accra, Ghana, leveraging our existing resources to explicitly incorporate an analysis of LCLUC in the southern and most urban portion of Ghana, as shown in Figure 1. Based on the reasoning described above, the UN projects that Ghana's rural population will decline over the next several decades. All of the population growth in rural areas is likely to be absorbed by cities, as the redundant rural population seeks jobs in urban places. This rapid growth of cities, which are already characterized by a high degree of informality and a low level of infrastructure, means that LCLU in urban areas is constantly evolving, and that this transformation of the built environment will be associated with inequalities in the social, economic, and health conditions.
We hypothesize, then, that demographic and health outcomes in Ghana are strongly impacted by LCLUC. First, we hypothesize that the rapid increase in land consolidation, driven by international investments and measured remotely by a signature pattern shift from mottled mixed land use small farms to large industrial plantations is a key independent driver of urbanization vis a vis rural farm labor displacement. We also hypothesize that the quality of life in major Ghanaian cities, measured in terms of socio-economic and health variables, is driven largely by intra-urban LCLUC. The nominal study period is 1986 to 2010, with an emphasis on 2000 to 2010 for which demographic and census data are more complete. The realities of remote sensing and demographic data collection and data availability determine the actual period of analysis, which will vary slightly across the study area. The primary geographic unit of analysis will be the enumeration area (EA); equivalent to a census tract in the US, EAs range from less than a hectare in urban areas to several hundred square kilometers in rural areas.
Objectives
- To identify, map, and quantify LCLUC within an extensive study area of Ghana over 25 years (1986 through 2010),
- to understand the relationship between rural-to-urban migration as an outcome of LCLUC and concomitant drivers for the 2000 through 2010 period, and
- to assess LCULC and its effect on demographic and quality of life factors for four major Ghanaian urban centers during this time period.
Hypothesis
Virtually all of the major LCLUC in both rural and urban areas of Ghana are directly or indirectly driving patterns of inter-regional population change
Team
Our interdisciplinary team consists of remote sensing, human-environment, landscape, ecological, and social scientists from:
San Diego State University (lead)
Douglas Stow (PI), John Weeks (Co-PI), Lloyd (Pete) Coulter (Project Manager), Li An (Co-Investigator), Magdalena Benza-Fiocco (Post-doc), Sory Toure (PhD Student), Nicholas Ibanez (MS student), Helena Taflin (MA student), Ace Shih (MS student), Sean Taugher (MA student), Milo Verjaska (MS student)
The George Washington University
Ryan Engstrom (PI), Qin Yu (Post-doc), Avery Sandborn (MA student)
University of California Santa Barbara
David Lopez-Carr (PI), Cascade Tuholske (PhD student)
University of Ghana
Samuel Agyei-Mensah and Foster Mensah (CERSGIS) (Collaborators)
Study Area
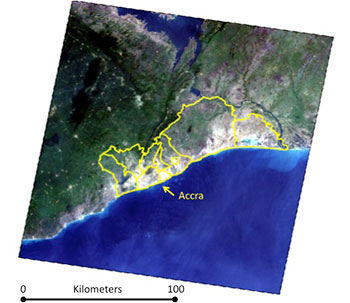
There are four regions of interest for which LCLUC is being identified, quantified, and mapped: Greater Accra, Central, Ashanti, and Eastern. With these regions, LCLUC is being be mapped with the greatest detail for the cities of Accra, Kumasi, Obuasi, and Cape Coast. The cities are shown in red in Figure 1, and the four regions are shown are shown as light colored polygons, with Greater Accra at lower right, Central at lower left, Ashanti at upper left, and Eastern at upper right.
Land Cover and Land Use Classification
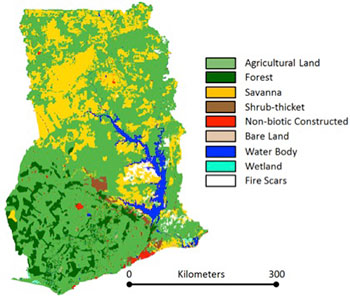
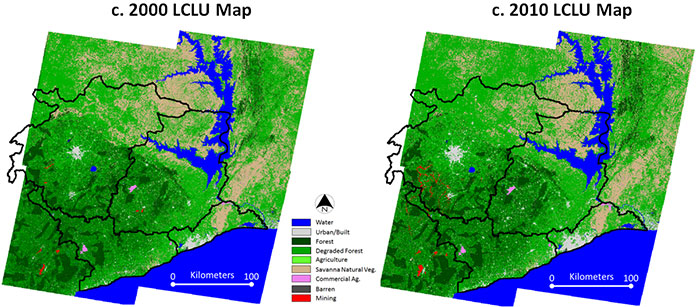
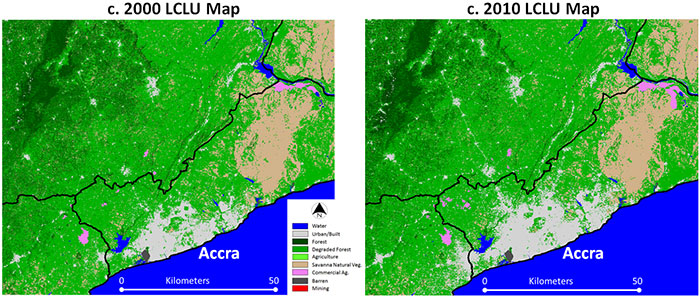
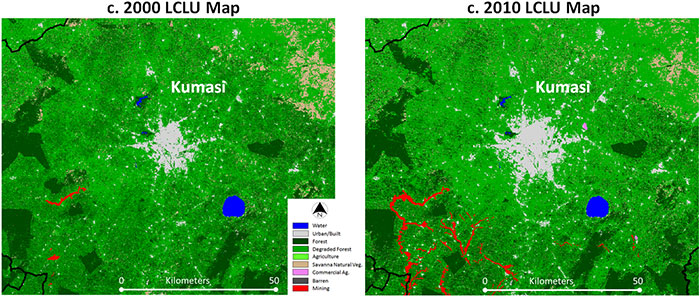
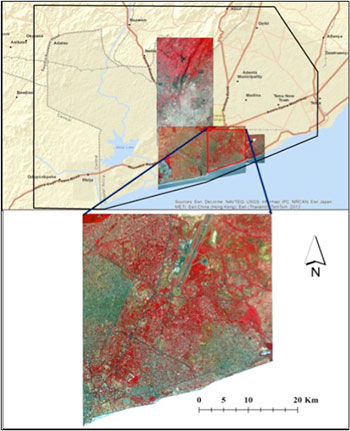
Land cover and land use is being mapped for c.2000 and c.2010 periods, and changes between these LCLU maps will be utilized (in conjunction with direct image-based change detection products) to identify LCLU changes of interest. Inter-regional identification of LCLUC is based on moderate spatial resolution, multi-temporal image data primarily from Landsat TM/ETM+ and LCDM OLI optical satellite systems (Figure 2). Where/when required, data from Terra ASTER, SPOT HRV, AWiFS and DMCii., and ERS-2 synthetic aperture radar (SAR) satellite systems will be also used. In addition, a map created by the Center for Remote Sensing and Geographic Information Services (CERSGIS) representing land cover conditions for 2000 is being utilized in conjunction with imagery for identifying c.2000 land cover conditions (Figure 3). The inter-regional LCLU classification scheme below is being used to classify moderate spatial resolution imagery across the four regions. Example inter-regional LCLU products are shown in Figures 4-6. These draft products are considered Version 1.0, and Version 2.0 (final) products are expected to be completed by February 2015.
Inter-regional LCLU classification scheme
- Water
- Urban/built (city core, suburban, peri-urban, village)
- Forest
- Degraded Forest
- Agriculture
- Savanna Natural Vegetation
- Commercial Agriculture
- Barren
- Mining
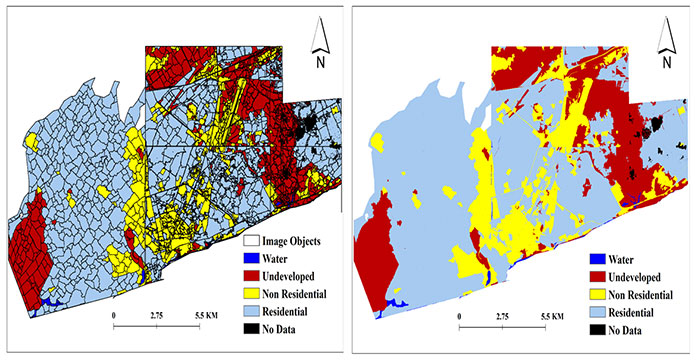
High spatial resolution image data from QuickBird, IKONOS, GeoEye-1, and WorldView-2 commercial satellite systems are being utilized primarily for intra-urban mapping and analysis of LCLUC (Figure 7). The intra-urban LCLU classification scheme below is being used to classify the high spatial resolution imagery corresponding to the extents of the four cities. Example intra-urban LCLU image classification products are shown in Figure 8. These products are considered to be draft products as well. Final products will be published when available.
Intra-urban LCLU classification scheme
- Water
- Undeveloped
- Urban Non-residential
- Urban Residential
- Urban Agriculture
Analysis of Regional-scale Impacts of LCLUC on Migration, Demography, and Health
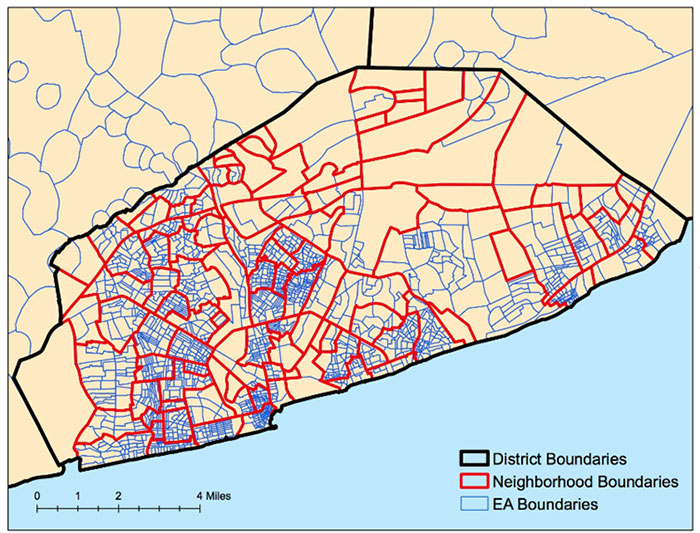
Unlike most developing countries, demographic, socioeconomic and health data for Ghana exist in higher quality and quantity than for most other developing countries, with national and nongovernment organization data collection programs starting in the early 1990s. We are utilizing quantitative spatial analysis techniques to examine relationships between LCLUC and magnitudes and changes of demographic, socioeconomic, and health variables. While EAs are the basic spatial analytical unit, analyses are also being conducted at multiple spatial scales, including: District (first level of agglomeration above EAs), Sub-regions (generated by merging EA units using socio-economic similarity and spatial autocorrelation measures, or field verified neighborhoods as in Figure 9), and Regions (state-level units). Relationships of LCLUC with demographic/socio-economic variables will be explored for EAs sampled in the 1993, 1998, 2003 and 2008 Demographic and Health Surveys, as well as for the 2000 and 2010 census data for all EAs within the study area.
Outcomes
Project Reports
Conference Papers & Presentations
Posters
Doctoral Dissertations
- Benza-Fiocco, Magdalena (SDSU/UCSB) Degree of Urbanization and Population Dynamics: A Case Study in Sub-Saharan Africa Utilizing Remotely Sensed Imagery, John Weeks, Adviser, completed February 2014.
- Mensah, Foster (U. Ghana) Detailed Land Cover and Land Use Change Assessment of Accra, Ghana, 2000 – 2010, Sam Agyei-Mensah, Adviser, in progress.
- Toure, Sory (SDSU/UCSB) Urban Land Use and Land Cover Change in Ghana: Connections to Demography, Health and Wealth, Doug Stow, Adviser, in progress.
Master's Theses
- Ibanez, Nicholas (SDSU) Spatial Patterns and Likely Drivers of Regional Land Cover and Land Use Change in Southern Ghana, 2000 – 2010, in progress.
- Sandborn, Avery (GWU) Quantifying Spatial Features of Built-Up Areas and Their Relationship to Quality of Life Indicators in Accra, Ghana, in progress.
- Shih, Hsaio-Chien (SDSU) Determining start of land cover and land use change based on discrete analyses of dense Landsat time series and spatial and temporal filtering, in progress.
- Vejraska, Milo (SDSU) Image Metrics As Indicators of Socioeconomic and Demographic Characteristics in Slum Neighborhood of Accra, Ghana, John Weeks advisor, completed June 2013.
Manuscripts Accepted and in Preparation
- Benza, M., Weeks, J., Stow, D., López-Carr, D. and Clarke, K. A, in preparation. Pattern based definition of the urban context using remote sensing and GIS: A case study in West Africa, Remote Sensing of Environment.
- Benza, M., Weeks, J., Stow, D., López-Carr, D. and Clarke, K., in preparation. Comparing a GIS based urban gradient to the census definition of urban spaces in Ghana, Population, Space and Place.
- Coulter, L., Ibanez, N., Tsai, Y-H, Weeks, J. and Stow, D., in preparation, Exploiting Landsat ETM+ time stacks to map land cover and land use in a cloud-prone region, Remote Sensing of Environment.
- Engstrom, R., Burgdorfer, J., Grasser, J., Cheiryadat, A., Bright, E., Qin Y., and Bhaduri, B., in preparation. An evaluation of a remotely sensed methodology of slum mapping in Accra, Ghana.
- Engstrom, R., Ashcroft, E., and Rain, D., in preparation. Mapping spatial variability in health and wealth Indicators in Accra, Ghana.
- Stow, D. H-C, Shih and L. Coulter, 2014, Discrete classification approach to land cover and land use change identification based on Landsat image time sequences, Remote Sensing Letters, 5: 922-931.
- Toure, S. and D. Stow, in preparation. Land cover and land use change analysis using multi-spatial resolution data and object-based image analysis, Remote Sensing Letters.
- Vejraska, M., J. Weeks and D. Stow, in preparation. Satellite image metrics as indicators of socioeconomic and demographic characteristics in slum neighborhoods of Accra, Ghana, Photogrammetric Engineering and Remote Sensing.
Data: Demographic, Socio-economic, and Health
- Georeferenced census and survey data, available by request
Data: Imagery and Geographic Information Systems (GIS) Products
- Regional/urban LCLU maps (c.2000, c.2010)
- Landsat temporal composite images (e.g., NDVI stack max 1999-2003 and 2009-2013)
- CERSGIS 2000 land use map
- Administrative boundaries
- Road networks